Introduction
Candlestick charts are one of the most popular tools in technical analysis. They help traders visualize price movements and predict future market trends. Among these, bearish candlestick patterns are especially important because they often signal a potential market downturn. For traders, spotting these patterns early can mean the difference between protecting profits and suffering losses.
In this article, we’ll explore what bearish candlestick patterns are, why they matter, and the most common types you should know.
What Are Bearish Candlestick Patterns?
A bearish candlestick pattern is a chart formation that suggests sellers are gaining control over the market. These patterns usually appear after an uptrend or at resistance levels, signaling that prices may soon fall. Traders often use them to identify potential selling opportunities or to prepare for a market reversal.
Bearish patterns don’t guarantee a price drop, but they increase the probability of downward movement. When combined with other indicators like volume, moving averages, or RSI, they provide stronger confirmation.
Why Are Bearish Candlestick Patterns Important?
- Early Warning of Reversals – They alert traders when an uptrend may be losing strength.
- Risk Management – Spotting these patterns helps investors exit before prices fall sharply.
- Entry Points for Short Trades – For traders who profit from falling markets, bearish signals create entry opportunities.
- Improved Decision-Making – They give traders a psychological edge by highlighting where buyers are weakening.
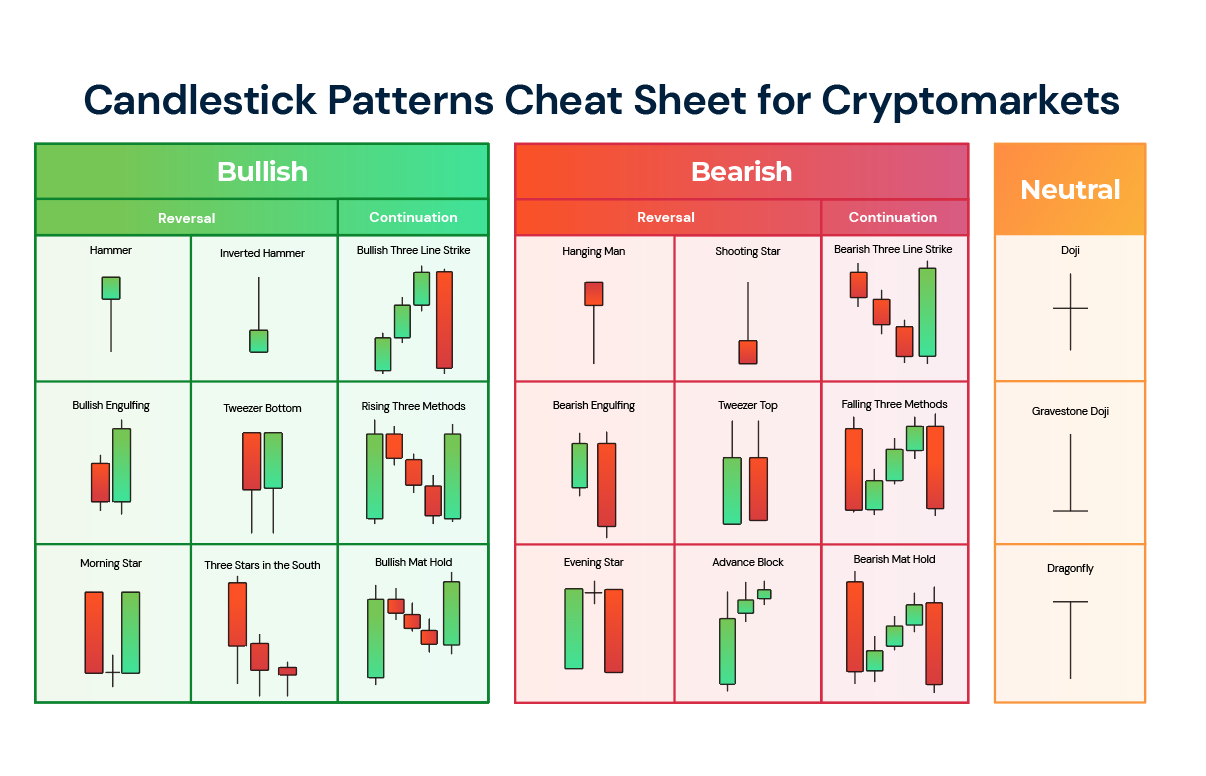
Common Bearish Candlestick Patterns
1. Bearish Engulfing Pattern
- Appears after an uptrend.
- A small green (bullish) candle is followed by a larger red (bearish) candle that completely “engulfs” the previous one.
- This shows strong selling pressure and signals a potential reversal.
2. Shooting Star
- Forms after a price rally.
- The candle has a small body, little to no lower shadow, and a long upper shadow.
- It indicates that buyers pushed prices up, but sellers regained control before closing.
3. Evening Star
- A three-candle pattern.
- First: a strong bullish candle.
- Second: a small-bodied candle (can be bullish or bearish) showing indecision.
- Third: a bearish candle closing well into the first candle’s body.
- This is a strong reversal signal.
4. Dark Cloud Cover
- Appears after an uptrend.
- A bearish candle opens above the previous bullish candle but closes below its midpoint.
- It suggests that buyers lost strength and sellers are taking over.
5. Hanging Man
- Looks like a hammer but forms after an uptrend.
- Has a small body with a long lower shadow.
- Suggests that selling pressure increased even though the price closed higher.
6. Three Black Crows
- Consists of three consecutive bearish candles.
- Each candle opens within the previous one’s body and closes lower.
- Indicates strong selling momentum and a potential long-term downtrend.
How to Trade Bearish Candlestick Patterns
- Wait for Confirmation: Don’t act on the pattern alone. Use indicators like RSI or MACD to confirm weakness.
- Check Volume: Higher selling volume strengthens the bearish signal.
- Use Stop Loss: Always place stop-loss orders above resistance to manage risk.
- Combine with Support/Resistance: Patterns are more reliable near key levels.
Final Thoughts
Bearish candlestick patterns are powerful tools for traders who want to anticipate market downturns. By recognizing patterns like the bearish engulfing, shooting star, evening star, dark cloud cover, hanging man, and three black crows, traders can make smarter decisions and protect their investments.